
IRSA provides accurate and reliable data to university administrators, departments, and faculty to illuminate and inform their decision-making. IRSA also provides a variety of information for federal and state mandated reporting (including accreditation), and for college guides and other external publications.
Announcements
The 2023-24 CDS is now available!
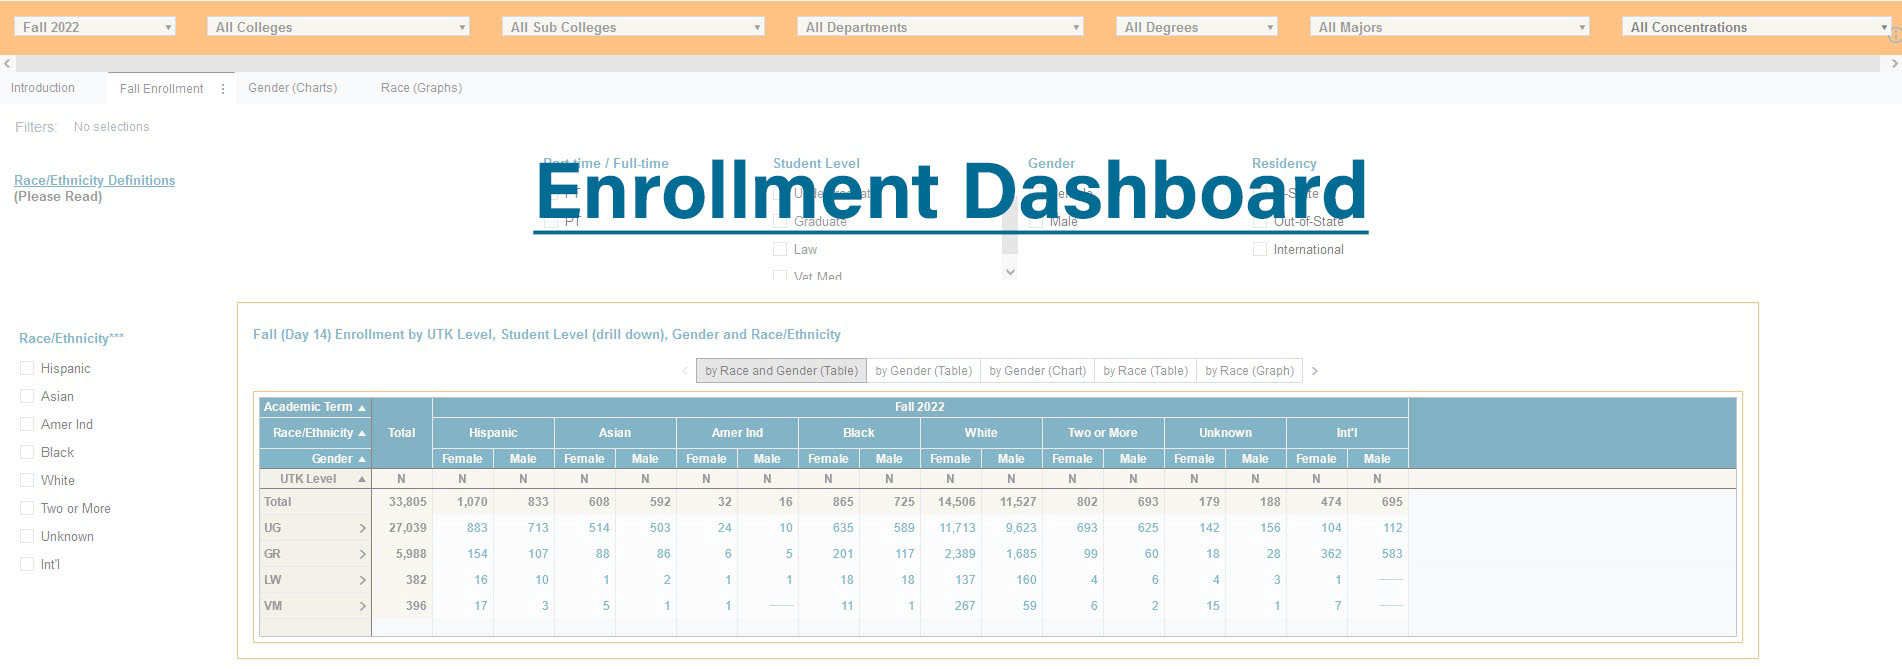
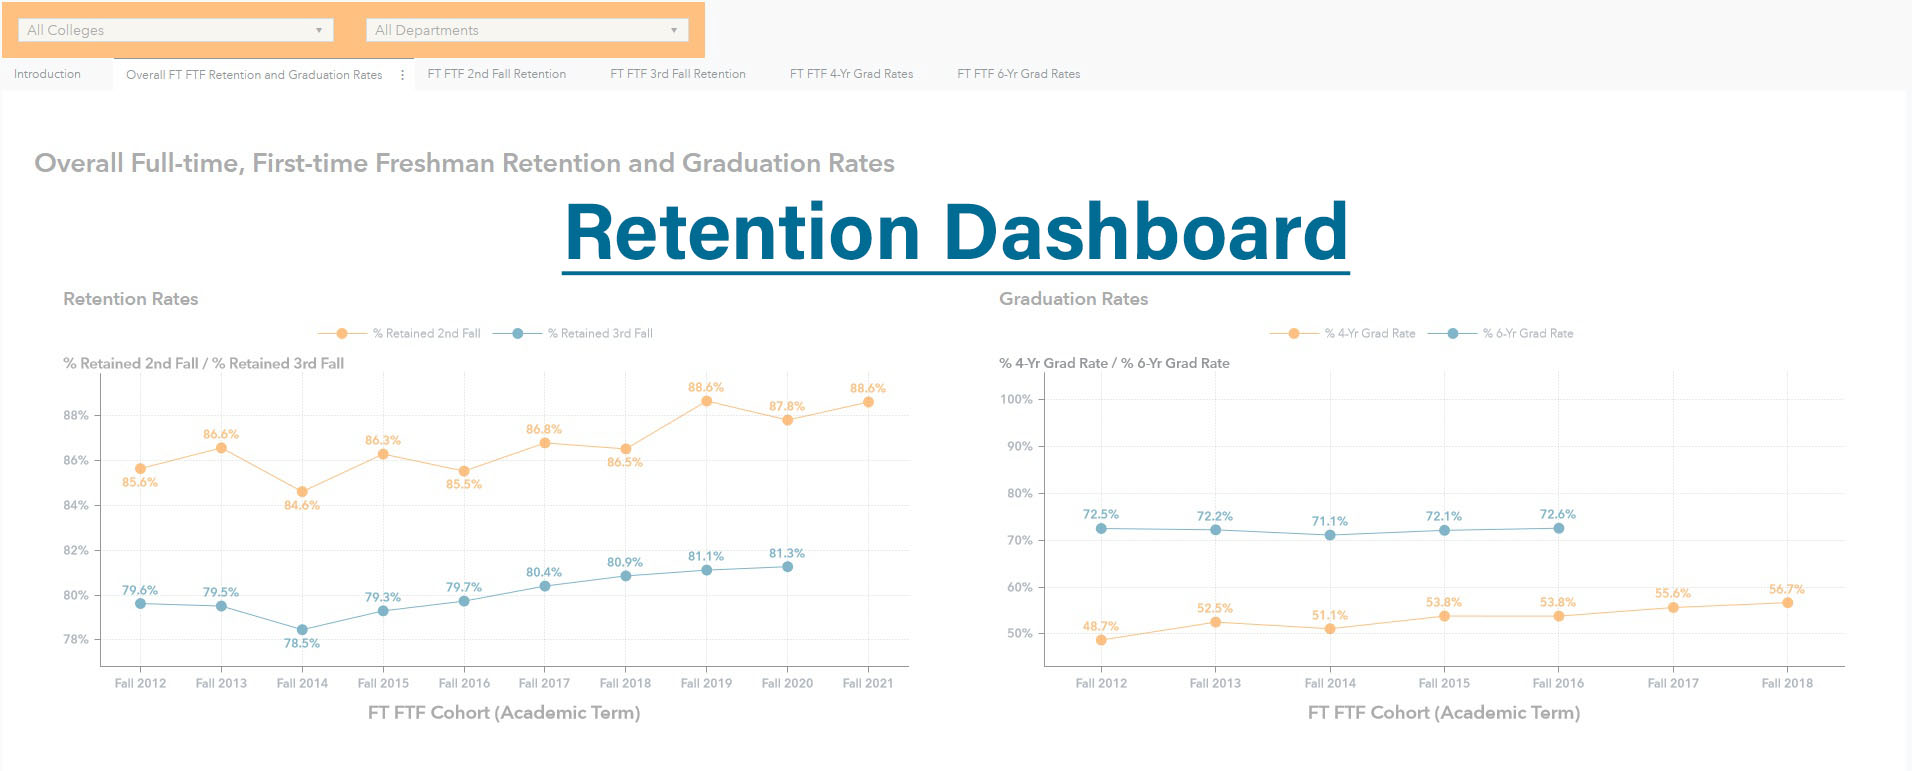
Our Dashboards have been updated with the Fall 2023 information!
Check out the Data Resources Overview for a guide to the different available resources.